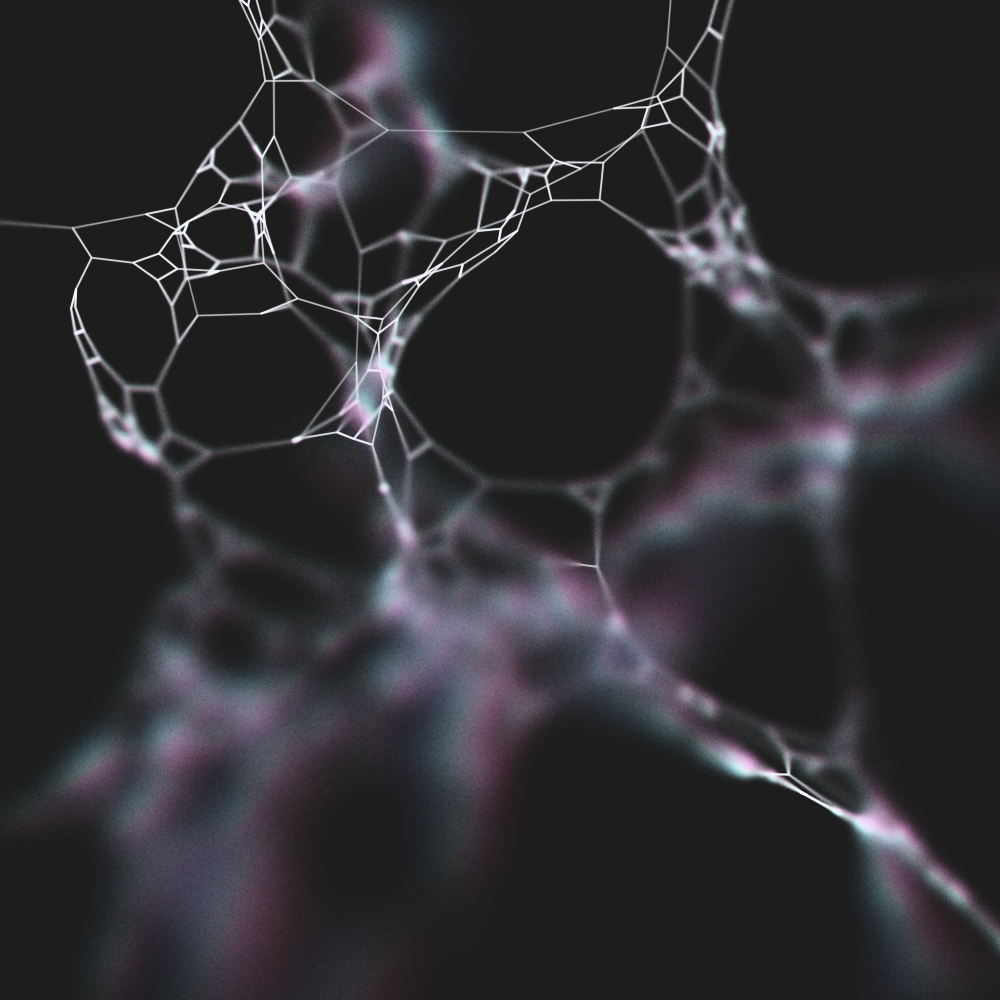
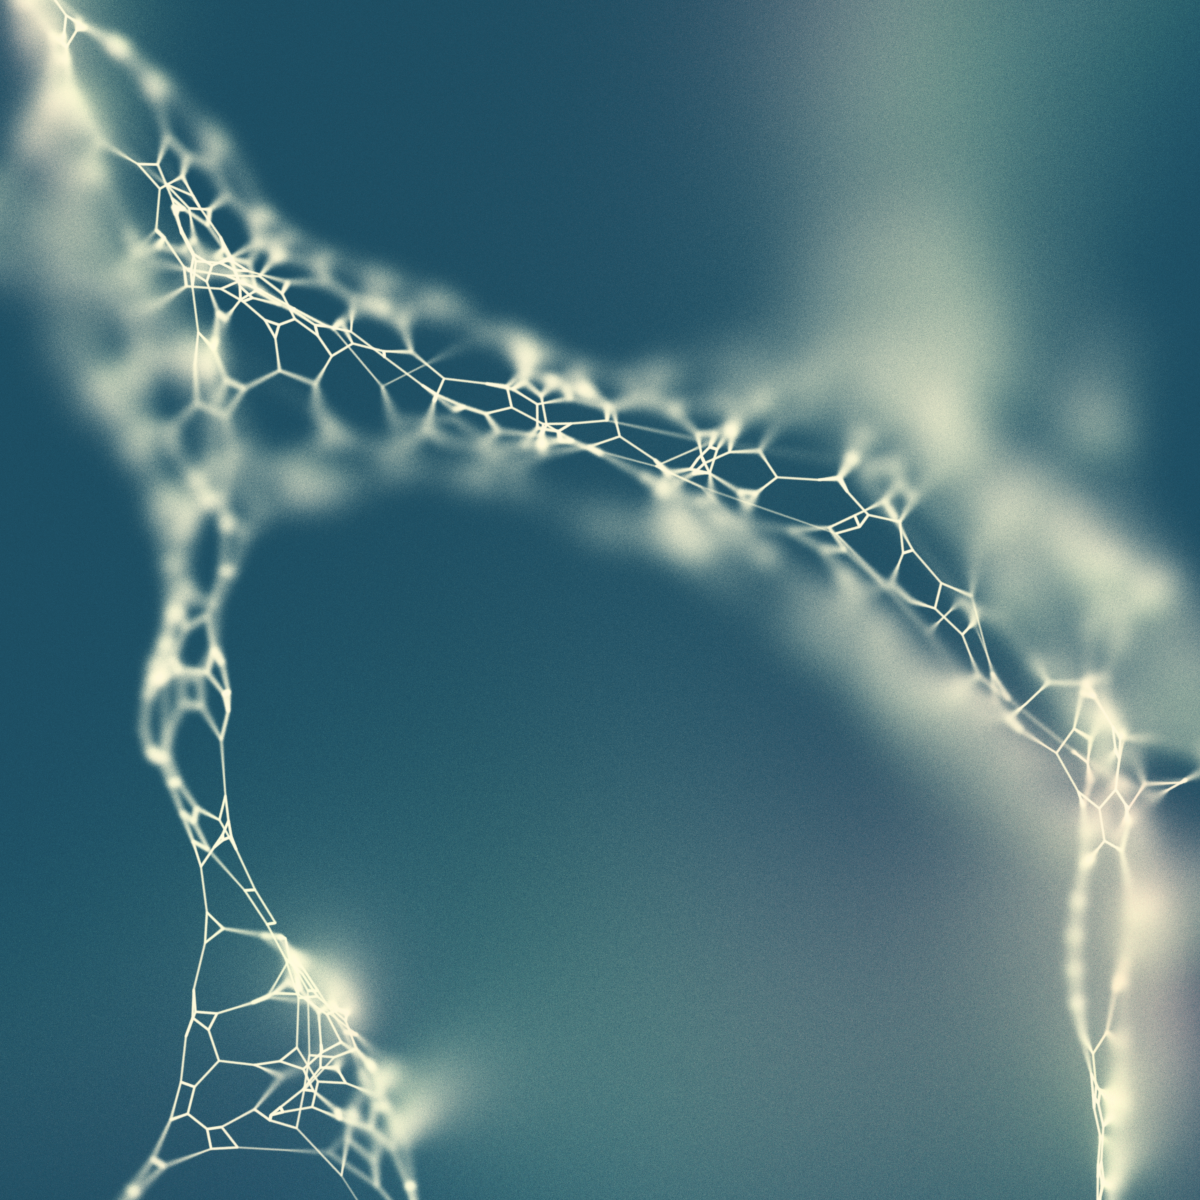
The last time I wrote, I described a relatively easy way to get a nice depth of field effect. Let's see how we can add a colour shift effect as well. I've tried to repeat most of the relevant information here, but you might want to read the previous post before you continue.
We can modify the depth of field algorithm so that you offset the rendered point in two dimensions, not in 3D. That is, we offset it inside a circle, not a sphere. This has the added benefit of requiring slightly fewer calculations. And it will look quite similar.
We assume that we have the same definitions as before:
- A line in 3D,
l=[a, b]; - a camera at position,
c; - a focus distance from the camera,
f - a distance function,
dst(a, b)that yields the distance betweenaandb; - a function,
lerp(a, b, s) = a + s*(b-a), which interpolates betweenaandb; - a function,
rnd(), that yields random numbers between0and1.
In addition, we need the following new functions:
rndNorm(), returns a normally distributed random number with a zero mean and unit variance. ;rndNorm2D(r) =, returnsr * [rndNorm(), rndNorm()]clamp(v, l, h), returnsmin(h, max(l, v));pow(a, b), returnsato the power ofb;cross(a, b), returnsa.x*b.y - a.y*b.x;hsvToRgb(h, s, v)converts a HSV value to an RGB value;nrm(v), scalesvto unit length; andproj(v), projectsvfrom 3D into 2D.
The modified algorithm is as follows:
; a point on lv = lerp(a, b, rnd()); projection of v on the canvasq = proj(v); sample radius based on distance to camera; larger m yields more blur; start with e=1 and adjustr = m * pow(abs(f - dst(v, c)), e); random vectoro = rndNorm2D(r); position to draw on canvasw = q + o; mid is the middle of your canvasx = cross(nrm(q-mid), o)
Finally we are ready to obtain the colour value. We assume HSV where where hue,
saturation and value range between 0 and 1. This
also assumes a dark background. To obtain different results, you will have to
experiment.
; start with he=1, and adjust; lower hs yields more colour variationrr = pow(abs(r) / hs, he); select your coloursif r < 0:; cyan-ishhueStart = 0.5 else:; magenta-ishhueStart = 0.833 hue = clamp(hueStart + rr, 0, 1); start with se=1, and adjust; higher ss yields lower saturationsat = clamp(pow(abs(r) / ss, se), 0, 1); value = 1rgb = hsvToRgb(hue, sat, 1)
Now that we have an RGB colour we can
draw a point at w using rgb. As in the previous post, this method
relies on sampling a large number of points from
l, and drawing those points with a low alpha
value.
There are a number of factors in here that will depend on the 3D shapes
you are drawing, the desired output resolution as well as your programming
environment. The trickiest part might be to scale the values of
hs, he, ss and se. Keep
in mind that you want hue and sat to fall largely
between 0 and 1. The clamp functions
are there for safety.
Hopefully this is enough to give you some ideas.
- Note that this is a description of how my code works, it is not an "out of the box" solution.
- This is a little simplified. My projection function,
proj(v), uses orthographic projection. Because of this, the distance function does not calculate the distance fromptoc. Instead it calculates the distance frompto the point wherephits the camera plane. Using the euclidean distance will also work. Depending on how you project, you might notice that the focal area is curved. - One way to get this is to use the Box-Muller transform. Many random number libraries will also provide this readily.
- This depends a lot on what tools you use. My images use an orthographic projection. Mostly because it is not too complicated to implement.


